Due Today: Paper Airplane Test Conclusions
Classwork:
We are sharing our conclusions. If a partner is confused when they read your conclusion, this is your opportunity to revise or edit the final version.
We are returning papers and organizing notebooks. During class, we are filling in our Notebook Self-Evaluation Checklist. Remeber to get your Parent Review Signed.
Tuesday, October 14, 2014

Monday, October 13, 2014
Paper Airplane Test: Communicating Results
Due Today:
A rough draft of your conclusion and procedures for the Paper Airplane Test
Classwork:
Have a partner read your procedures. If they can make your paper airplane exactly by following the step-by-step directions in your procedures, then they are well-written. If they get confused, then rewrite that part to clarify.
Use the rest of the class period to finish the final draft of your lab report-- type or write in ink.
You will also need to attach your Bibliography.
A rough draft of your conclusion and procedures for the Paper Airplane Test
Classwork:
Have a partner read your procedures. If they can make your paper airplane exactly by following the step-by-step directions in your procedures, then they are well-written. If they get confused, then rewrite that part to clarify.
Use the rest of the class period to finish the final draft of your lab report-- type or write in ink.
You will also need to attach your Bibliography.
Wednesday, October 8, 2014
Paper Airplane Test Part 2: Take Flight
Due Today: A Statement of Hypothesis
Class work
Warm-up: Writing Procedures…a Step-by- Step Set of Directions
How do you make your paper airplanes?
You will write procedures for how to build your planes with a partner in class.
Record the directions in a document titled Paper Airplane Procedures.
You'll need to read about Operational Definitions and include a few of those in your directions so it's clear what, when, and how to measure for your results.

We will do the experiment on Thursday. Bring a timer if you have one for Thursday in the Gym. We will record our data in our IA Notebooks on p.52.
Graph your data for homework on Thursday.
On Friday, you will have the whole class period to write your conclusion and share your discoveries about how to make a paper airplane stay aloft longer!
Monday, October 6, 2014
Paper Airplane Test Part 1.Getting Started
This week you are performing a scientific investigation to demonstrate your ability to use scientific methods appropriately.
 Your question to investigate must be a good scientific question related to making your paper airplane stay aloft longer.
Read and attach the project introduction on p. 47 in your IANotebook. Then log in to Google Classroom to take off on your research.
Remember to document your sources and take notes on the major ideas related to flight and paper airplanes.

Tuesday, in class we will begin writing our research summaries and putting together our bibliographies.
Whatever you don't finish in class will become homework.
The Statement of Hypothesis is due on Wednesday.
Your question to investigate must be a good scientific question related to making your paper airplane stay aloft longer.Read and attach the project introduction on p. 47 in your IANotebook. Then log in to Google Classroom to take off on your research.
Remember to document your sources and take notes on the major ideas related to flight and paper airplanes.
Tuesday, in class we will begin writing our research summaries and putting together our bibliographies.
Whatever you don't finish in class will become homework.
The Statement of Hypothesis is due on Wednesday.
Drawing Conclusions
Thursday, we discussed drawing logical conclusions from our data.
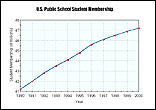
Remember, the dependent variable is what is measured as a result of changing the independent variable (what you're testing). For example, the air temperature depends on the time of day, so the air temperature is the dependent variable and plotted on the y-axis.
The time of day is changing so this is an independent variable on the x-axis.
When there is a cause and effect relationship between the two variables a line graph will result from plotting the data.
IF there is a directly proportional connection between the dependent and independent variable, what kind of line does your graph make?
What can you logically conclude by looking at the graphs?
Your notes on conclusion writing should be on p.47 in your notebook and the practice sheet Cause and Effect/Drawing Conclsuions will go next to it on page 46 in your IAN.
The Friday Quiz will be on graphing and the vocabulary in scientific inquiry.
Remember, the dependent variable is what is measured as a result of changing the independent variable (what you're testing). For example, the air temperature depends on the time of day, so the air temperature is the dependent variable and plotted on the y-axis.
The time of day is changing so this is an independent variable on the x-axis.
When there is a cause and effect relationship between the two variables a line graph will result from plotting the data.
IF there is a directly proportional connection between the dependent and independent variable, what kind of line does your graph make?
What can you logically conclude by looking at the graphs?
Your notes on conclusion writing should be on p.47 in your notebook and the practice sheet Cause and Effect/Drawing Conclsuions will go next to it on page 46 in your IAN.
The Friday Quiz will be on graphing and the vocabulary in scientific inquiry.
Graphing & Data Analysis: 9/30-10/2
Graphs can be misused in advertisements, implying that the claim is based on research! Beware of the Tricks of the Trade! Test your knowledge, wit, and skill to determine what's wrong with the graphs in the handout. This will be kept on p. 42 in our notebooks.
We started out with a lesson on bar graphs and progressed into line graphs. We graphed the Temperatures in September on a color -coded line graph in our notebook on p. 43
If you are still having a hard time with graphing, try these graphing tools and tutorials on the science home page.
The Friday Quiz will be on graphing and the vocabulary in scientific inquiry.
Thursday, October 2, 2014
How to Make Graphs
We are taking notes on IA Notebook p.41 on making graphs.
Redo the bar graph for your Water Drop Lab.
Use the notes from today's class to help you.
Redo the bar graph for your Water Drop Lab.
Use the notes from today's class to help you.
Subscribe to:
Posts (Atom)